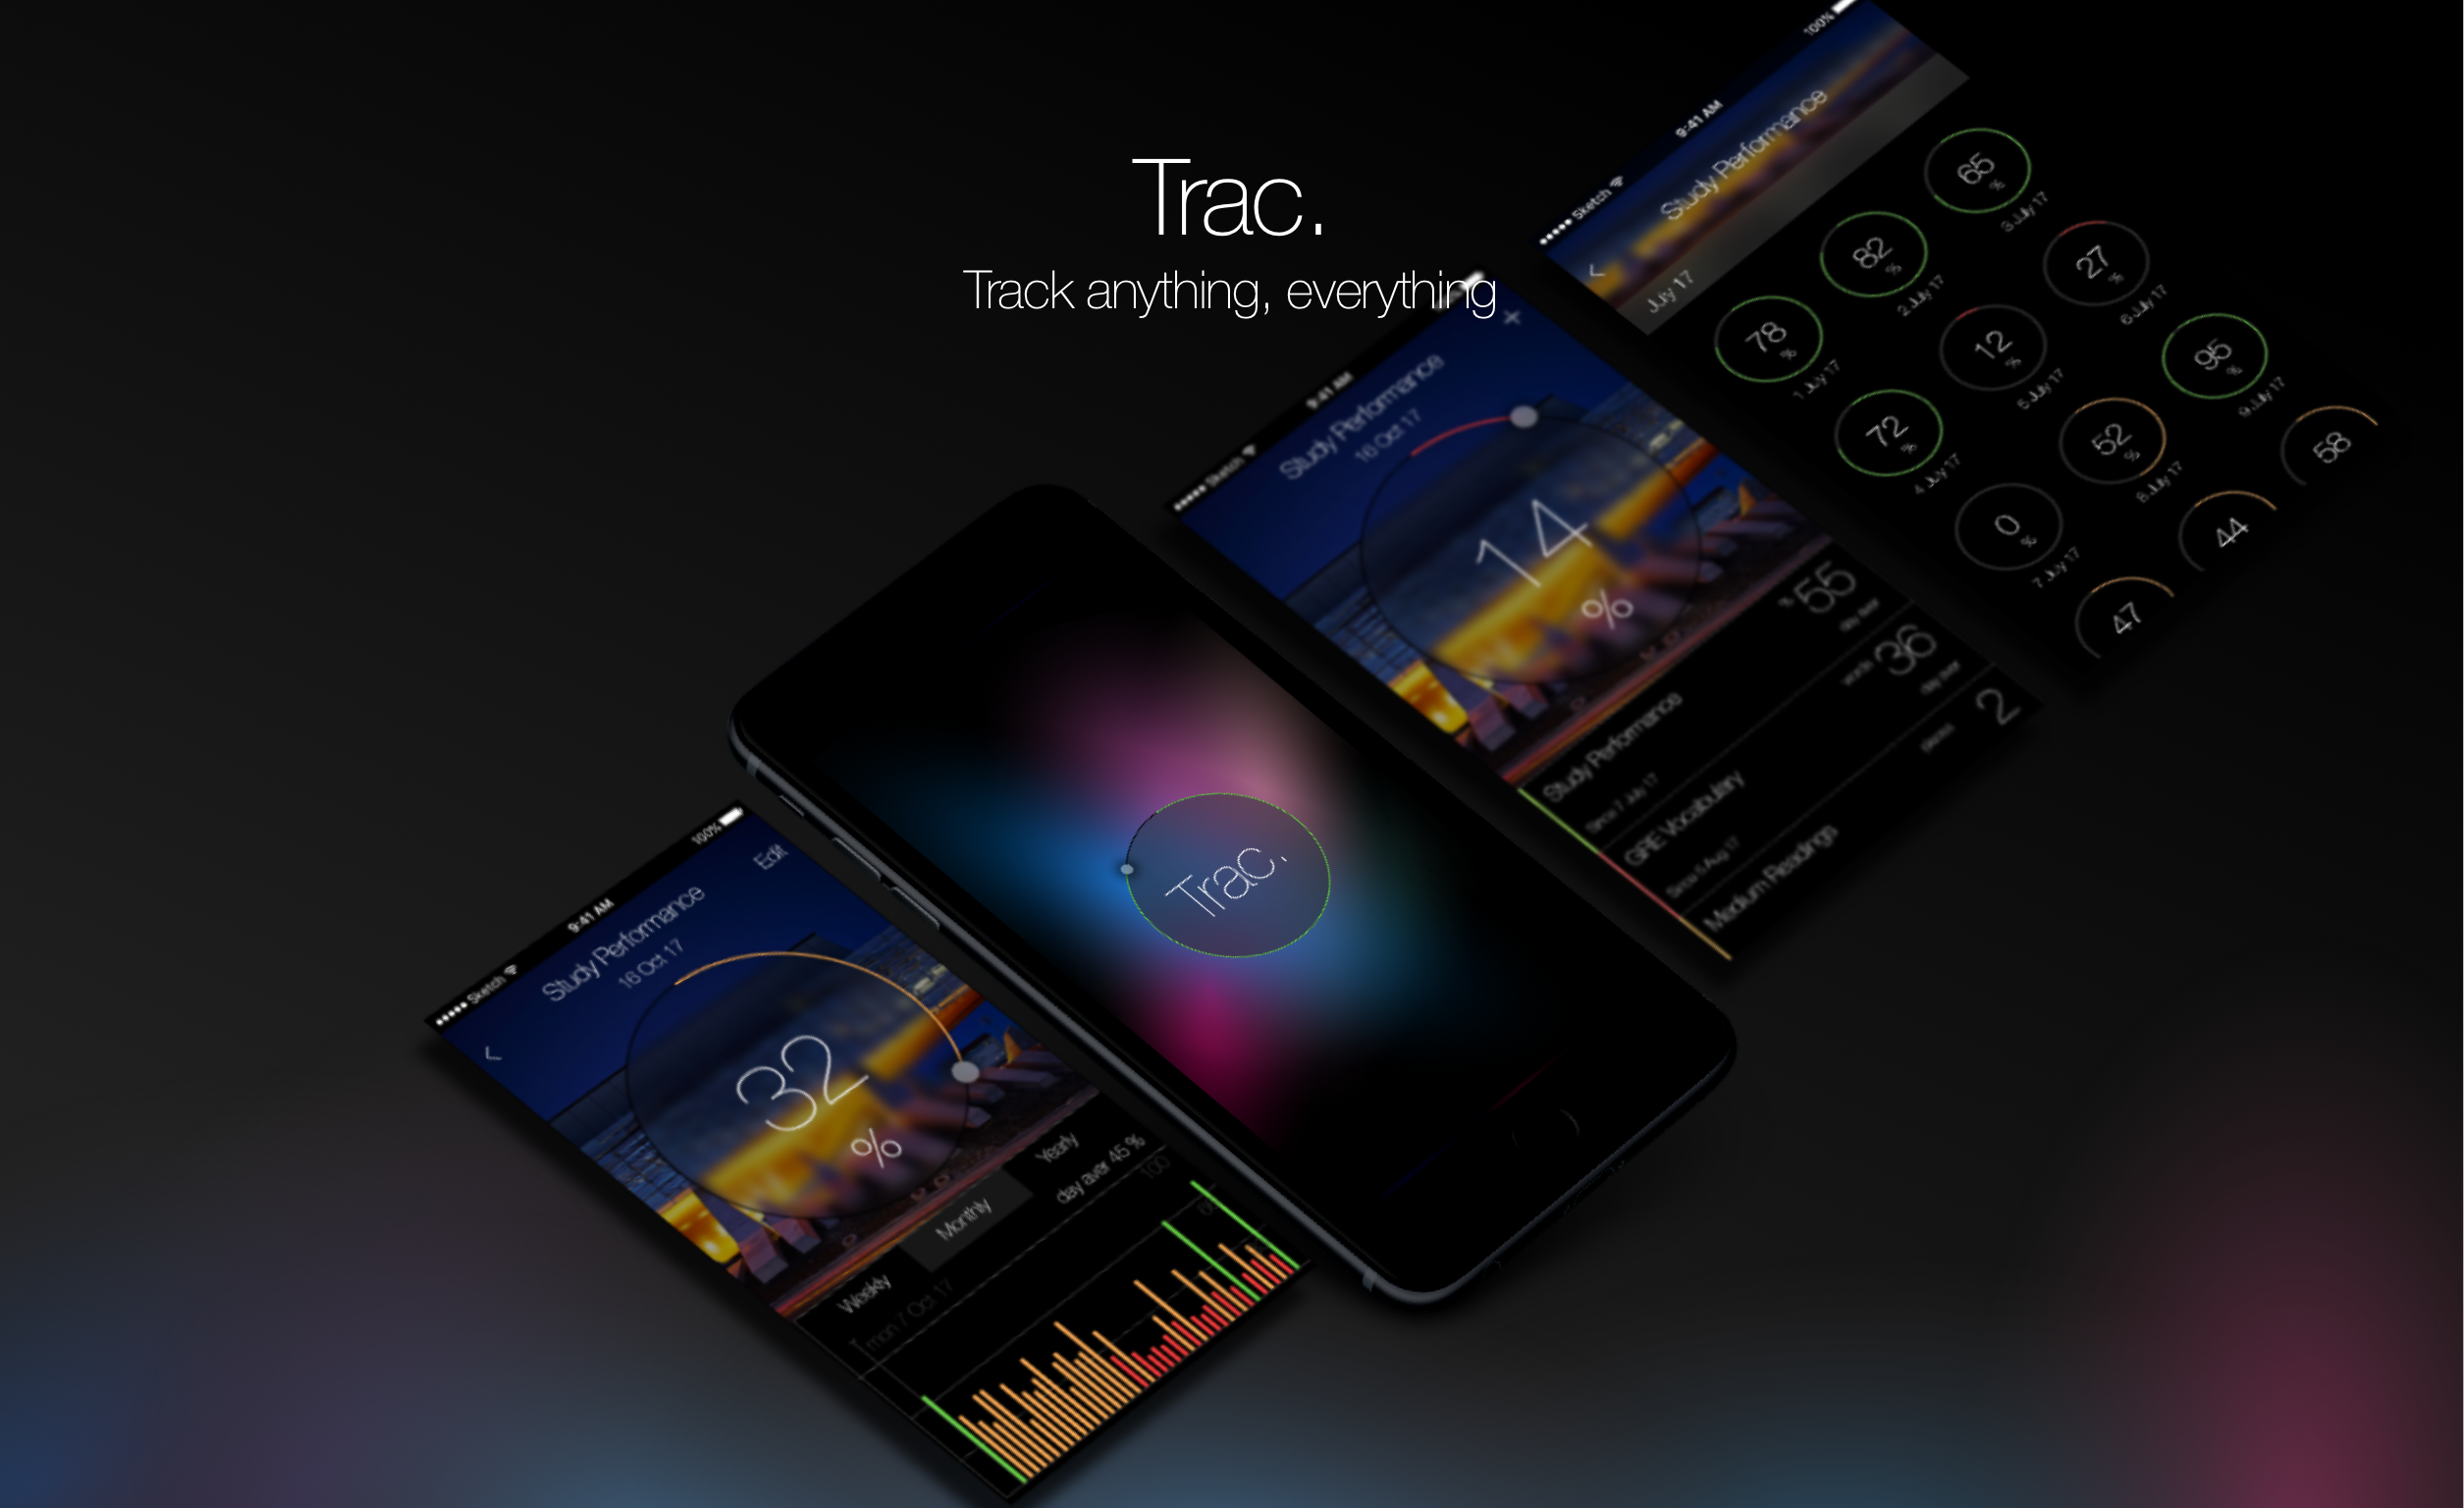
Trac.
Multi-purpose Performance Tracking
Practices
iOS UI Design
Design Thinking
User Centered Design
Tools
Sketch
Adobe Photoshop
Problem: "What is my overall performance?”
Design Initiative
In order to keep ourself reminded, everyday we build a todo list somewhere in our lives. We take down notes on our phones, we paste stickers on the wall. However, after a while we lost tracking of our progress in piles of used stickers. Although we know we are making progress towards our goal, but how was the overall performance?
Solution: One Stop Tracking Experience.
In working environments, there are all kinds of performance tracking systems. The idea is simple, people just do daily logs into a computer system, which would then generate monthly reports as output. In "Trac." we are trying to apply the same idea into tracking daily routines. It is built as simple as a daily reminder list, but it does more than just logging but also performance tracking.
User Studies
Persona
John is a University student, he studies Psychology and Information Science. He has a very busy life on campus as he studies two majors at the same time.
He has a giant todo list on his phone to keep track of everyday work and extracurriculum activities. He is now in his senior year and he plans to do a graduate school afterwards. Aside from school works, he made 3 month plan for graduate school application, which includes GRE preparation, GMAT preparation and statement of purpose drafting.
He now uses excel to log all his daily activies and every week he generates a chart of overall performance. The excel file was very helpful, however when a new item of tracking comes out, he has to redo the whole excel formula again to adjust for the new tracking item.
Requirement Analysis
-
Free-form todo list
-
Free-form daily log
-
Weekly Performance
-
Monthly Performance
-
Yearly Performance
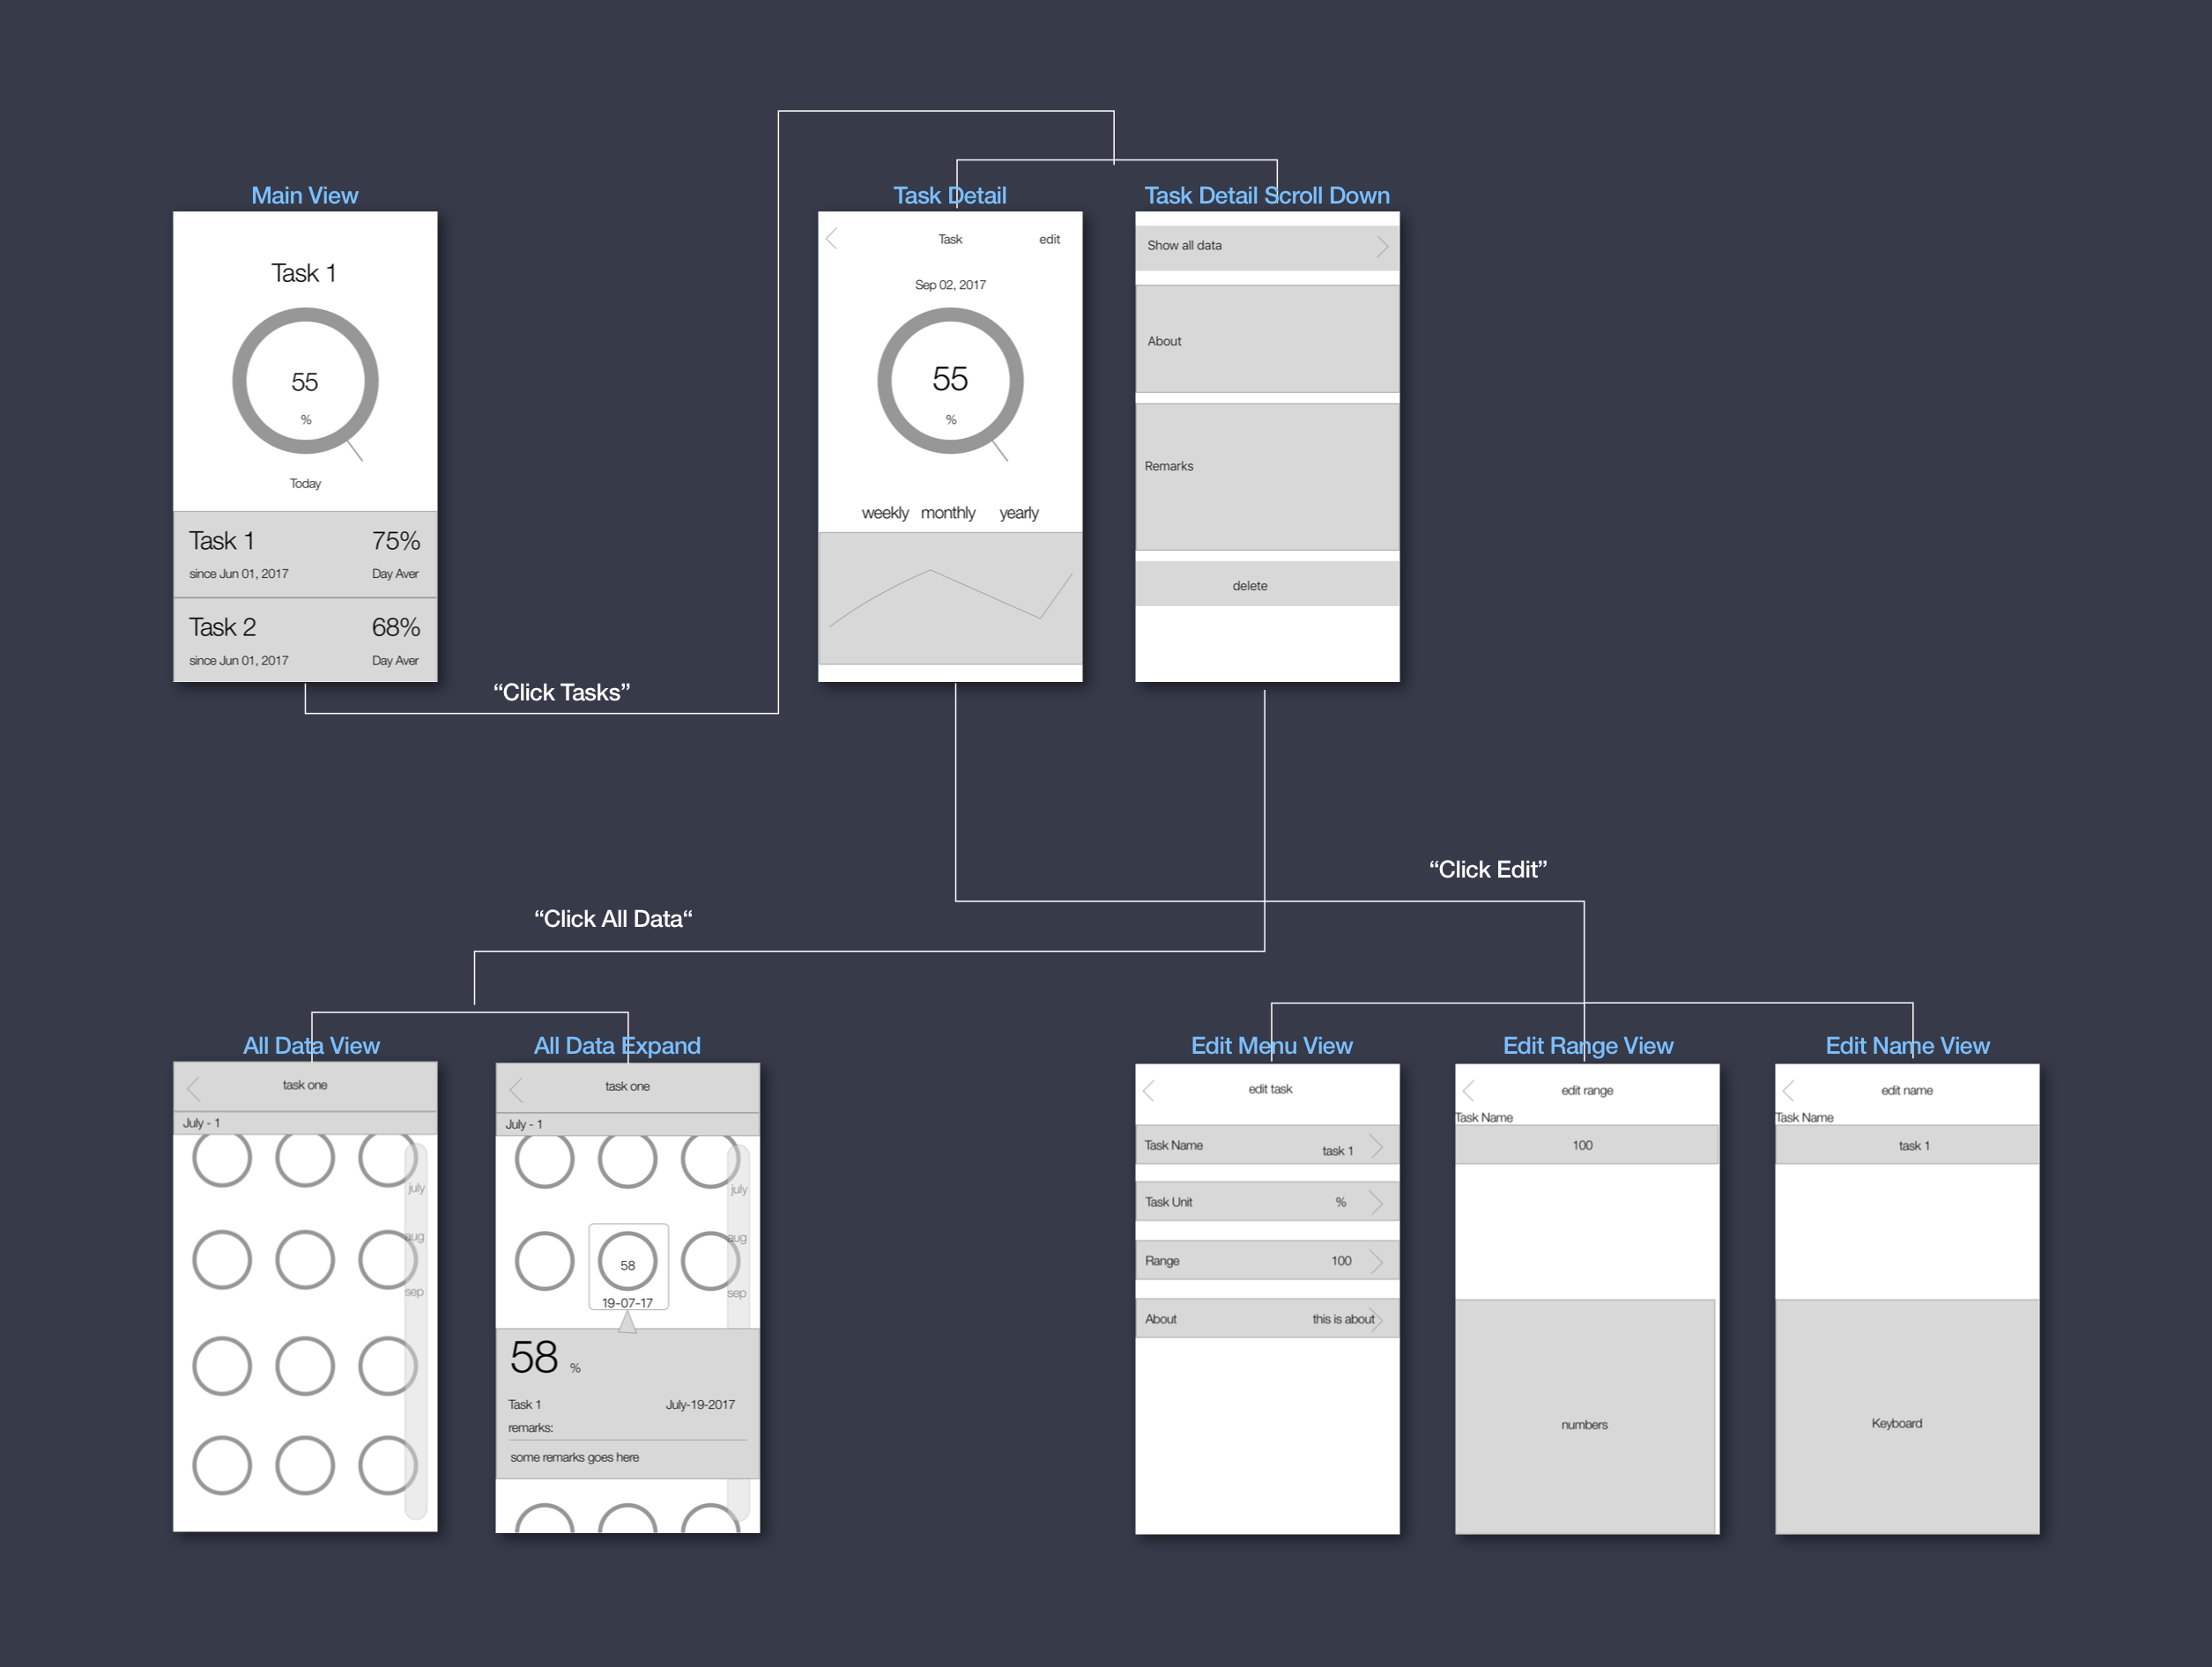
Conceptual Flow
The work flow is designed in a way of a mimicing a todo list style, where user tracks things based on individual tasks. Each task has its performance data logged on a daily basis.
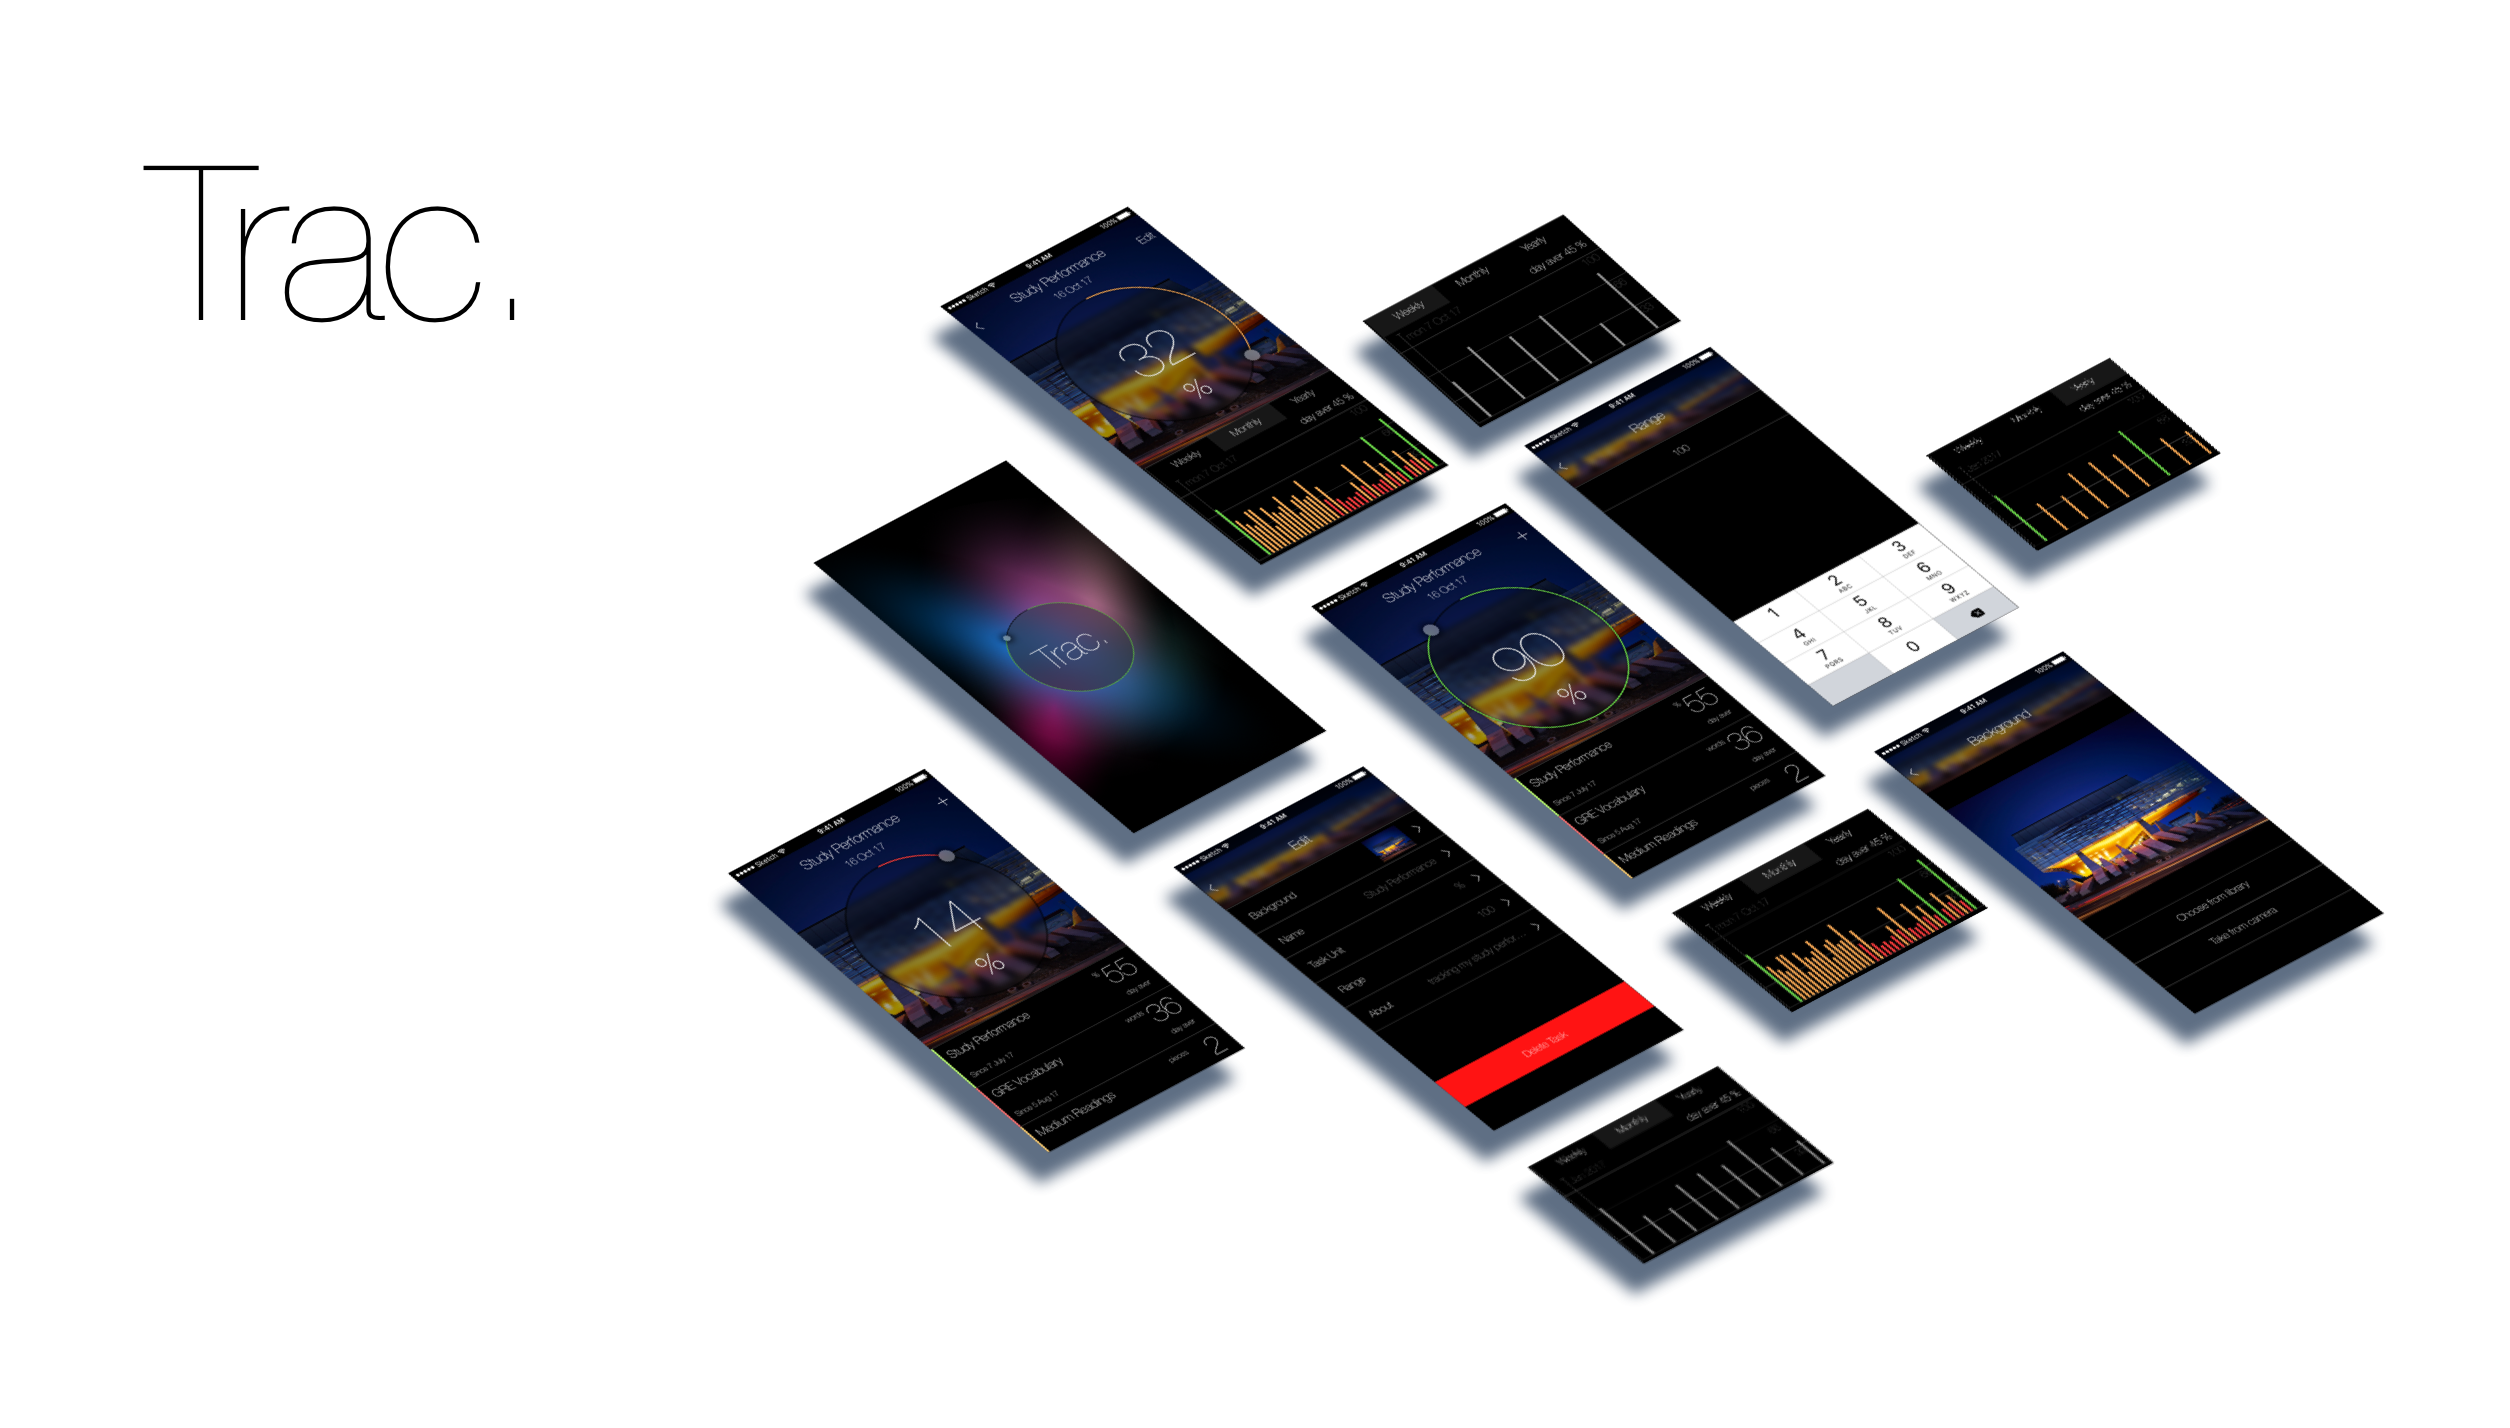
Final Product
Inspired from multiple apps, including Apple Weather, Apple Health, Fitbit App. We try to build the app with UI elements that are instictive to understand.
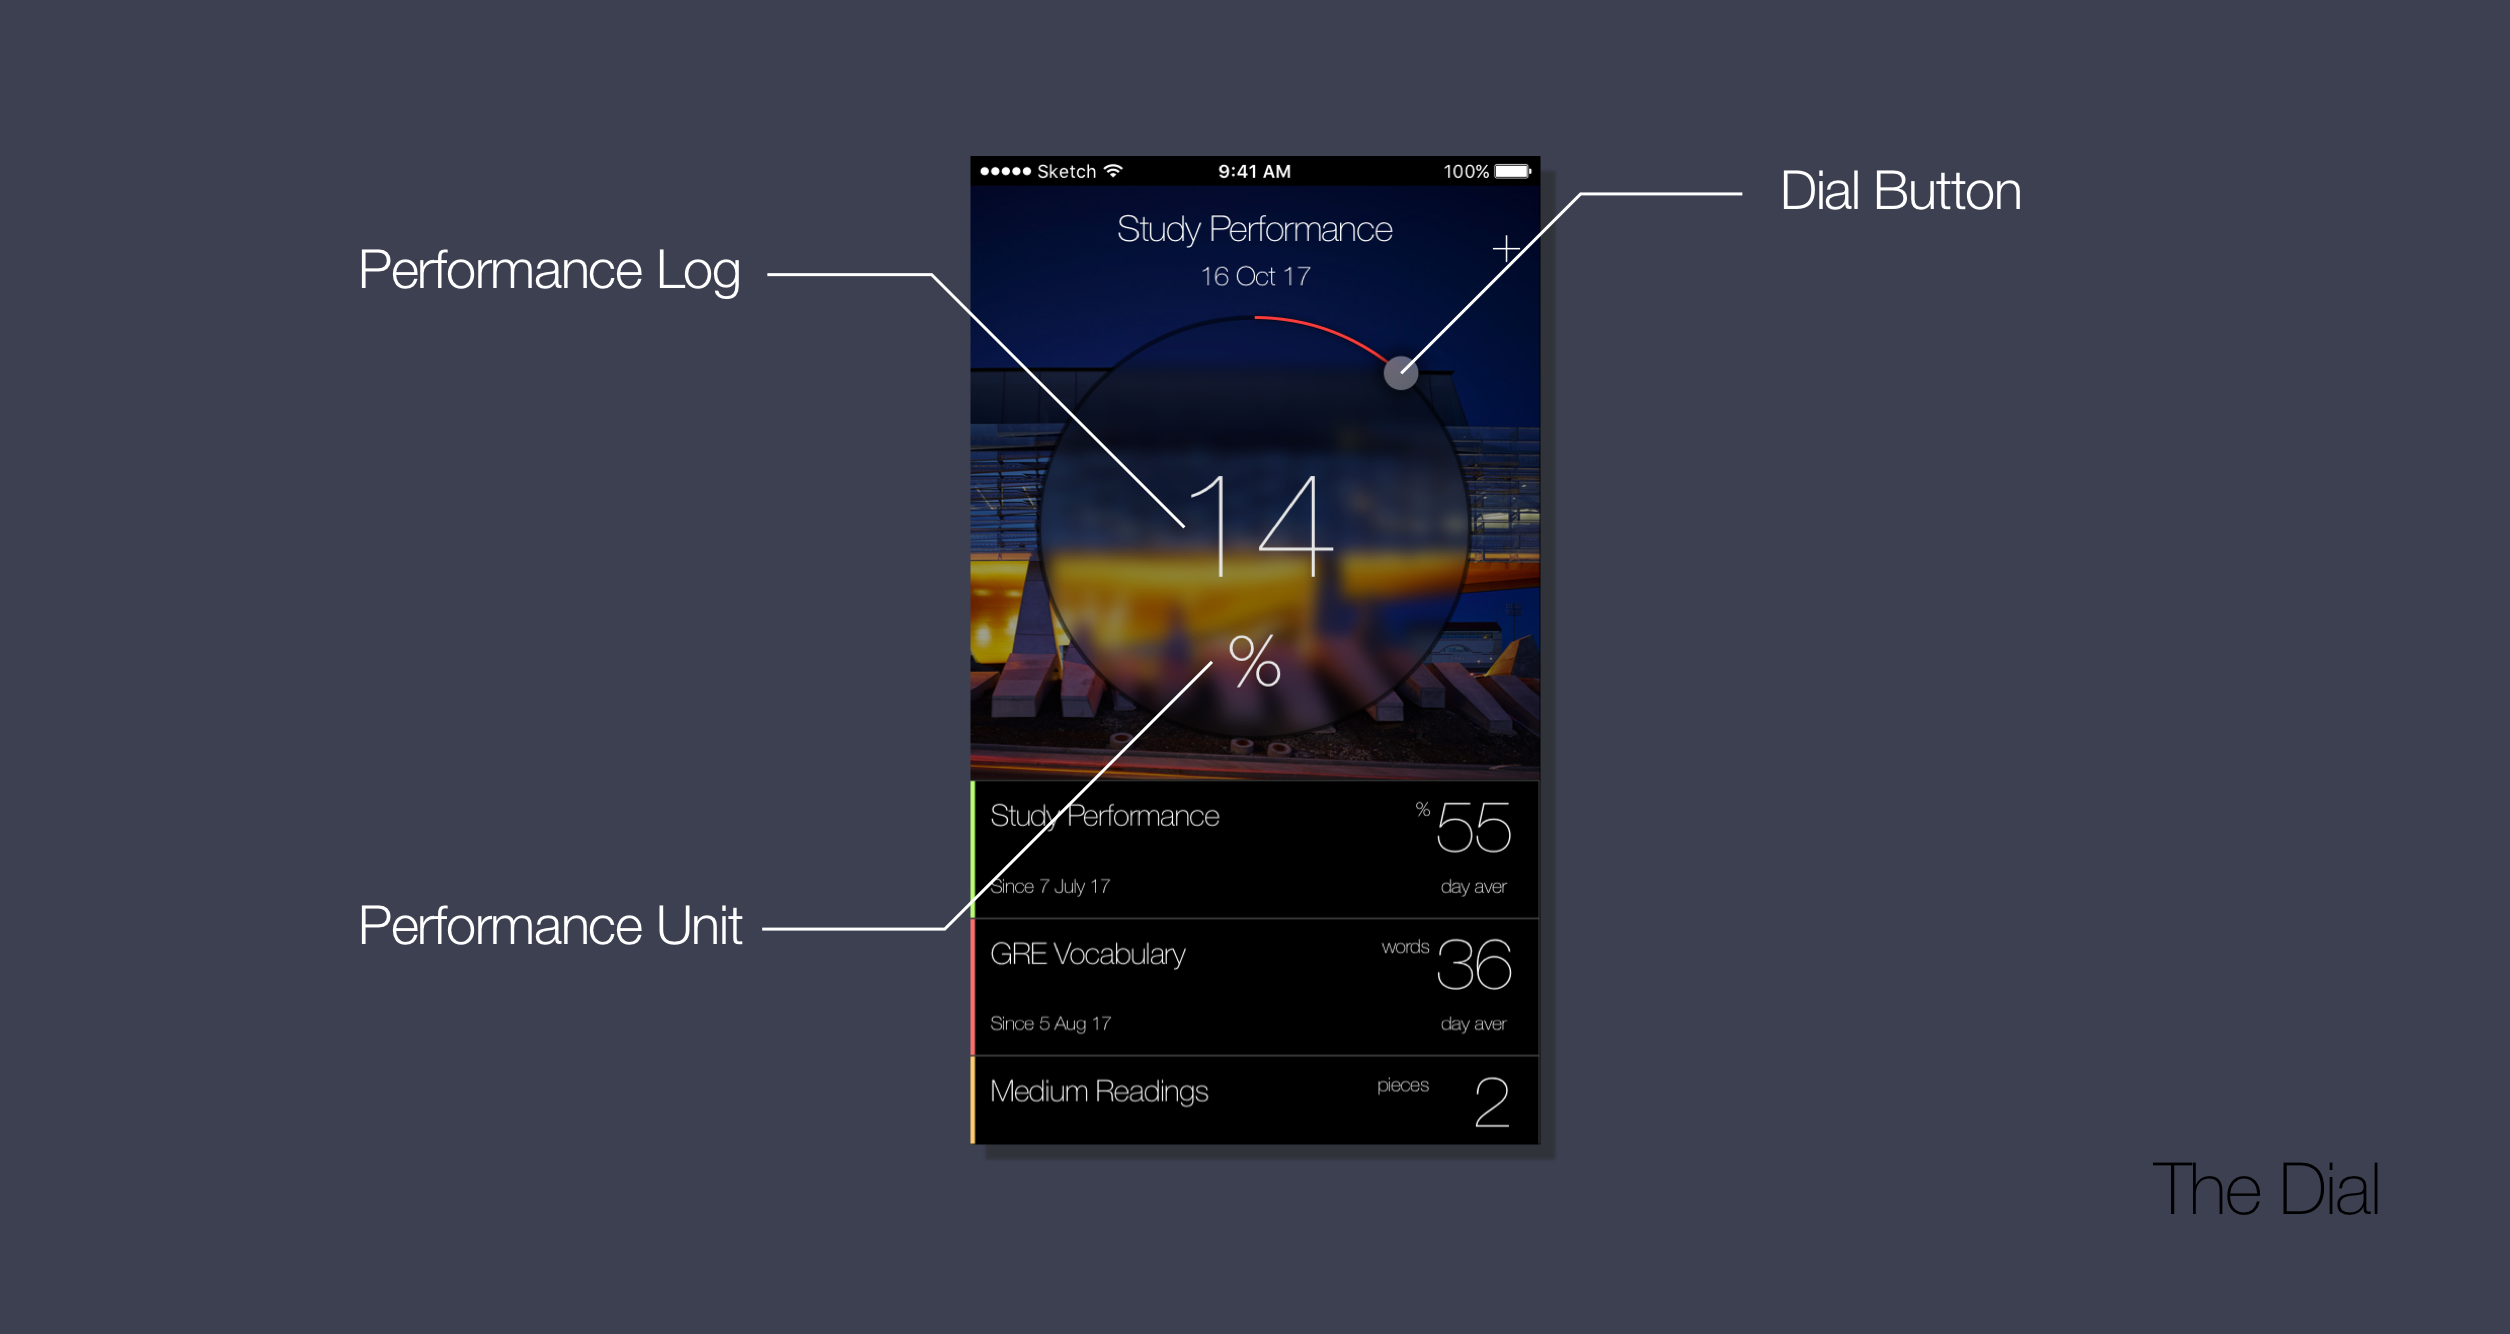
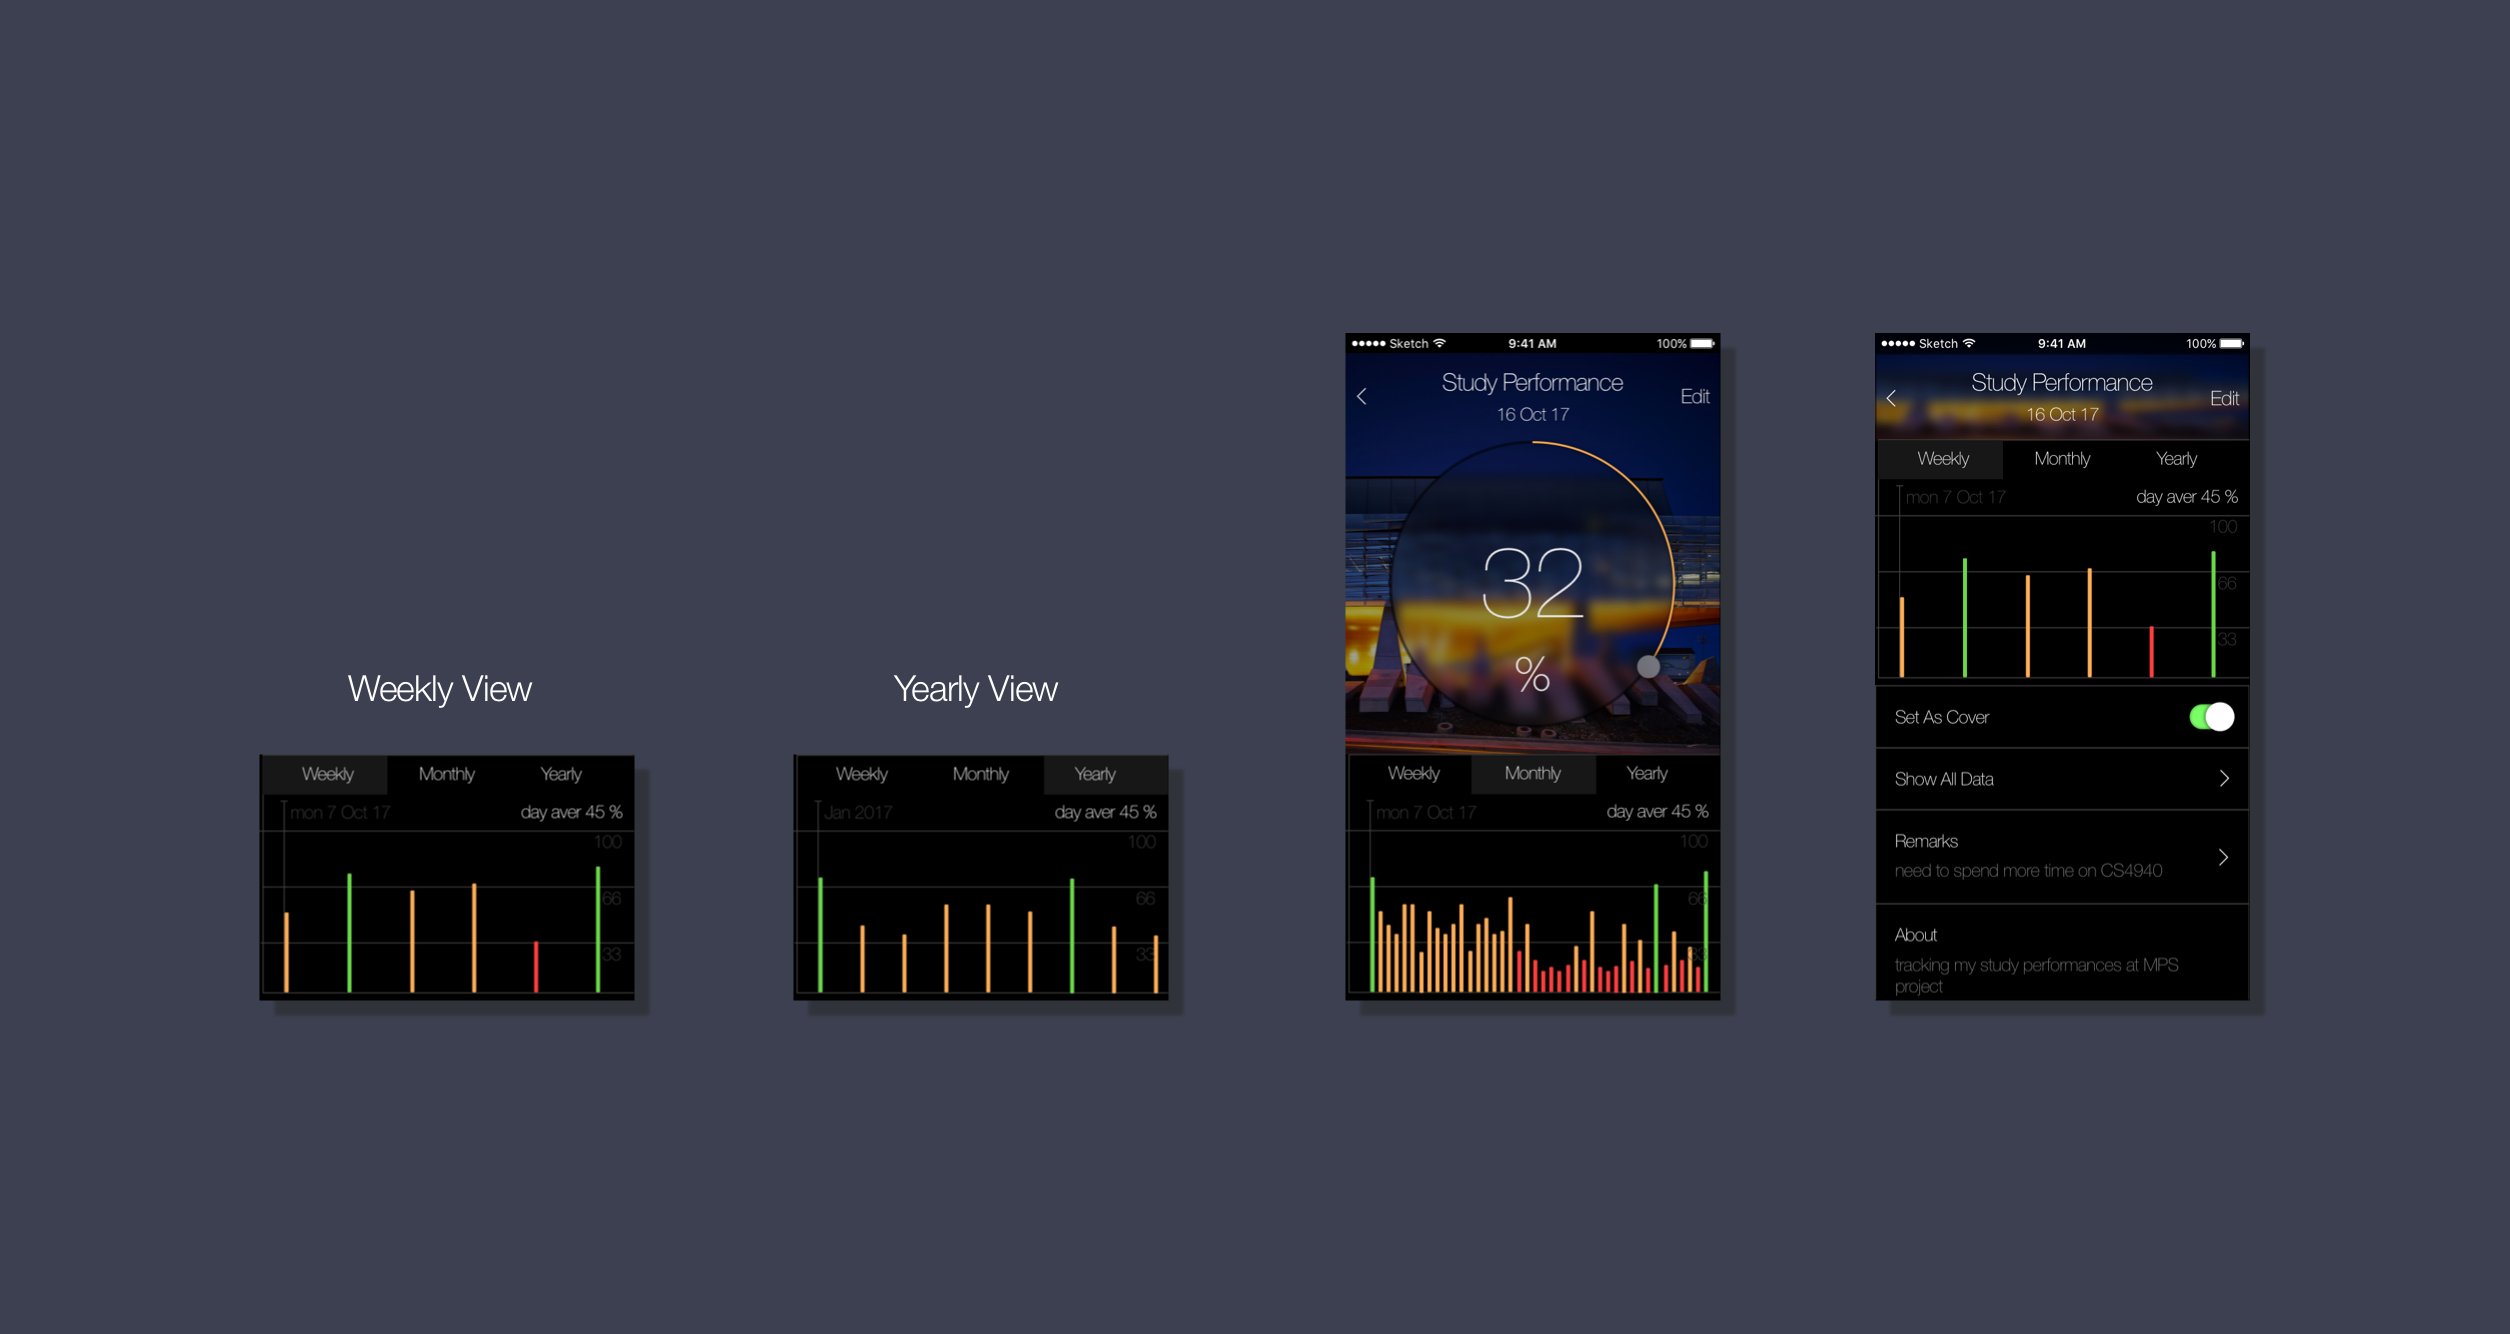
The Dial
The dial is the main mean of inputting user performance data. The main dial shows the performance of the day, with a user defined unit. User would simply use the dial button to adjust current day's performance.
Color System
Color is so much more effective indicating performance than numbers. Therefore we have the tracking system useing color code as the main indicator of performances.
In the dial, the color changes continuously as the user increases perfomances, starting from red and eventually ends up with green.
Although the dial follows a continous change of colors, To keep the main theme neat in style, we have only three colors for every other UI elements.
Red (#FF3D3D)
,
Yellow (#FFAD56)
,
Green (#6AD748)
3 Scales Overview
Within each of the tasks, aside from the current view. Data performance are presented in a line chart manner. Where user could select from three view options: Weekly, Monthly, Yearly.
Each view option would give user corresponding overview performances. The chart also calculates daily average since the beginning of the logging.
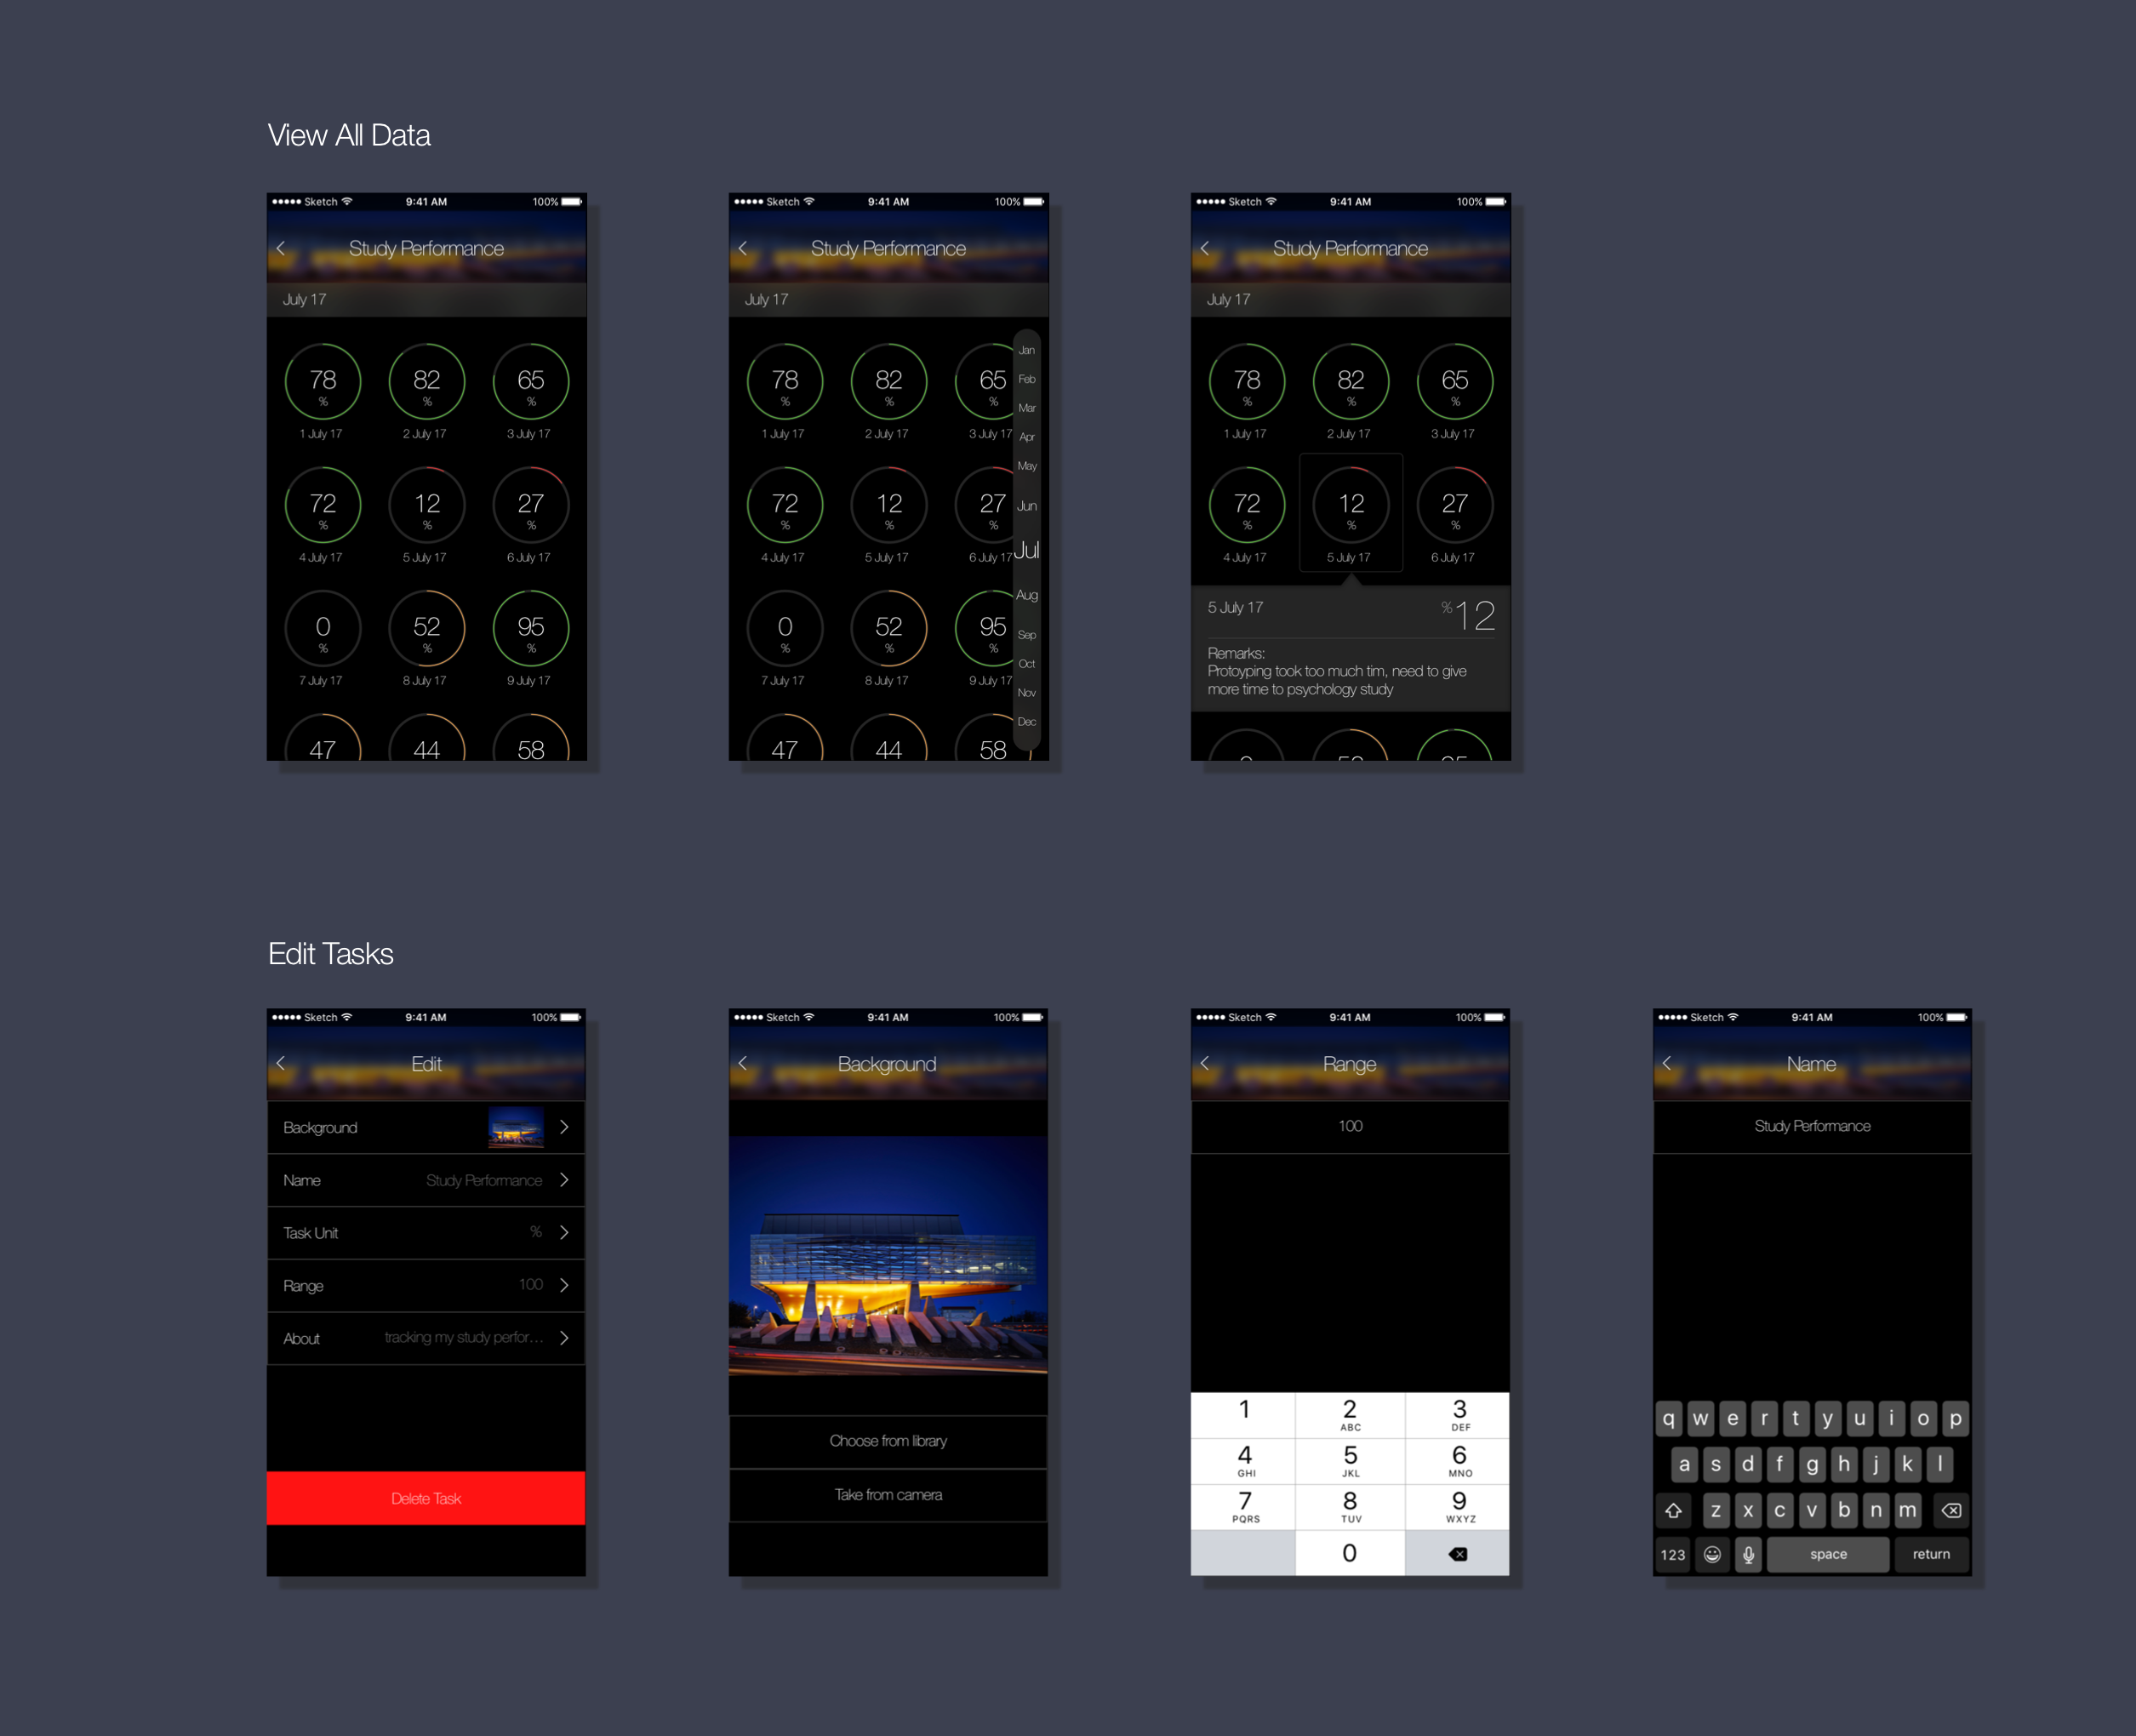
Data Archives
Every logging should comes with a history view. However, since the chart already provides an overview of performance, besides user normally does not check details of previous loggings, they are all archived as an clickable option under each of the task. Once expanded, they are orderly in a monthly order for browsing.
Flexible Logging
To provide user with a flexible logging environment. Every tasks comes with a name entry, a range enty, a unit entry and a background image option.